Skip to content

Retail Analytics

Digital Signage

Themepark Analytics

Your system for analyzing visitor frequencies.

Optimize the control of your branches.

We provide objective key figures.

Manage and control digital content centrally.

Take your marketing to a new level.

Efficient and contemporary.

Your system for analyzing visitor frequencies.

Optimize the control of your attractions.

We provide objective key figures.

Company

purematic was founded in 1999 by Michael & Markus Post as a company for individual software development. 2010 saw the creation of Bus&Bahn Technologie, a sales cooperation for calculating waiting times and determining key figures for the operation of attractions such as roller coasters, water rides and children’s rides. The forerunner of today’s pure.AIS system. At the same time, the digital signage business area was developed to offer park operators the possibility to display the determined waiting times, information and advertising on screens. The pure.DSS solution for central control and presentation of digital content on screens was born. Both systems are now in use in almost all major amusement parks in Europe and provide objective key figures for attractions and rides. With the expansion of our solution portfolio since 2015 under the name pure.AIS, our system for visitor frequency analysis has been consistently developed further for the retail sector in addition to the amusement park sector.  We also have well-known reference customers in this area. May we count you among them soon? We’d love to.

Installation

Installation

Our products are quickly and easily installed and set up at your location.

Security

Security

Encrypted transmission and certified data centers ensure security.

Web-Portal

Web-Portal

Web access to our applications allows you to work from anywhere.

Support

Support

We will process your support requests within 24 hours.

Usability

Usability

Clear menus facilitate the handling of our software.

Individual Requirements

Individual Requirements

We are happy to implement your individual software adaptations.

References

Your system for recording visitor frequencies.
We deliver objective key figures.


pure.AIS – Visitor Frequency Analysis in Retail
Accuracy

Accuracy

98%

Objectivity

Objectivity

100%

Security

Security

100%

Overview

Overview

The overview shows the status of the sensors of your branches as well as the visitors of past periods on a daily to annual basis. Additionally the previous inputs/outputs of the day, including current assignment.

KPI-Standard

KPI-Standard

Once cash register data has been imported from your system, you can see at a glance changes in current codes compared to any periods in the past.

Hotspots

Hotspots

In the detection range of each sensor (max. 7x5m), depending on the installation height, we evaluate the paths of your visitors. You get conclusions on the preferred ways and can optimize your product presentation.

KPI-Matrix

KPI-Matrix

Analyze concentrations within a week based on a key figure for any period. On which day of the last 3 months is the frequency highest?

Dwell time

Dwell time

Are visitors to your stores comfortable and well advised? Is the range attractive? Are the staff well trained and are there enough employees on the site? Why is the length of stay in a store very different?

Reporting

Reporting

Receive all key figures as a pdf report by e-mail. The daily, weekly, monthly, quarterly and annual summary can be found in your inbox the following day.

The linkage of the gained data with your sales figures enables the
Checking and optimizing the location very concretely and objectively with regard to:

Solutions for Retail

pure.AIS – Solutions for Retail

Practical examples

The stationary retail sector lacks detailed information about the behaviour of visitors at the point of sale. The evaluation of POS data only allows a one-dimensional analysis of the performance of a location and is not very meaningful in comparison between branches if the real potential of the respective locations is not known and weighted. Our solution for visitor frequency analysis with pure.AIS provides the basis for objective evaluations and comparisons of your locations.

Solutions cleverly combined !

pure.AIS visitor frequency analysis and pure.dss digital signage from one source!

Transport image

Transport image

Present your brand in a high-quality and contemporary way

Reduce waiting times

Reduce waiting times

Distract waiting customers with interesting content

pure.DSS

Digital Signage


Increase retention time

Increase retention time

Turn more visitors into buying customers

Promote offers

Promote offers

Make customers aware of special offers

Your system for central control of screen contents.
The digital signage platform for optimal marketing.


pure.DSS – Digital Signage System
Connecting

Connecting

Connect to the monitor and network via LAN or WLAN

Add contents

Add contents

Conveniently load your data into the media library

Creating a Storyboard

Creating a Storyboard

Define content for your Storyboard

Content customers

Multiple content customers can be managed via one access. Agencies have the possibility to manage and centrally control different customers and their content.

Dashboard

Thanks to the integrated dashboard you can check the status of your screens at a glance. Here you can also activate or deactivate screens with one click.

User concept

The user concept allows the assignment of different user rights with regard to content and the management of screens and schedules. Complex hierarchies can be mapped.

media library

Store your images, videos and pdf files in the media library clearly arranged, structured and centrally. All images are stored safely and without quality loss.

Quick access

The easy-to-use quick start and step-by-step instructions help you to create your content with just a few clicks and without extensive training.

Storyboard

In the flowchart you define which content is to be displayed on which screens or screen groups, in which period and with which repetition and length.

pure.DSS

So diverse!

Main

Your system for optimizing rides.
Crowd analytics at the theme park.

pure.AIS – Crowd analytics in Themeparks
Accuracy

Accuracy

98%

Objectivity

Objectivity

100%

Security

Security

100%

Overview

Overview

The overview shows the status of the sensors of your rides as well as the previous number of visitors, the current occupancy of the waiting room, the average waiting time and the throughput/hour

RPI-Standard

RPI-Standard

Whether number of persons in waiting room, waiting time, throughput per hour, occupancy per trip or the average lap time, you have objective indicators for evaluation and analysis at hand.

Heatmaps

Heatmaps

In the detection range of each sensor (max. 7x5m), depending on the installation height, we evaluate the paths of your visitors. You can draw conclusions about the preferred paths of visitors, e.g. in souvenir shops.

RPI-Matrix

RPI-Matrix

Analyze concentrations within a week based on a key figure for any period. On which weekday of the last 3 months is the waiting period highest?

Waiting time

Waiting time

Do you know the exact frequency of your attractions or certain parking areas? Do you know how long your visitors wait to experience an attraction? We calculate these values in real time and to the minute.

Reporting

Reporting

receive all key figures as a pdf report by e-mail. The daily, weekly, monthly, quarterly and annual summary can be found in your inbox the following day.

The data obtained allow checking and optimization

Your attractions very concrete and objective in relation to:

Solutions for the theme park

pure.AIS – Solutions for the theme park

Practical examples

The visitors of an amusement park want to experience their day in the park as smoothly and with pleasure as possible. The demand is to be able to take advantage of as much of the offer as possible and thus to generate little waiting time. Often the park management lacks detailed information which would allow e.g. the number of persons in the waiting area and waiting times to be calculated. Our Crowd analytics solution with pure.AIS provides the basis for objective evaluations of your rides. Combined with our digital signage product pure.DSS, this makes it possible to inform your visitors in advance about waiting times. Direct streams of visitors via targeted information on screens distributed throughout the park in order to achieve optimum parking capacity utilisation. You will see, the optimization of the utilization of your attractions, leads to higher customer satisfaction of your visitors.

Solutions cleverly combined !

pure.AIS Crowd analytics and pure.dss Digital Signage from one source!

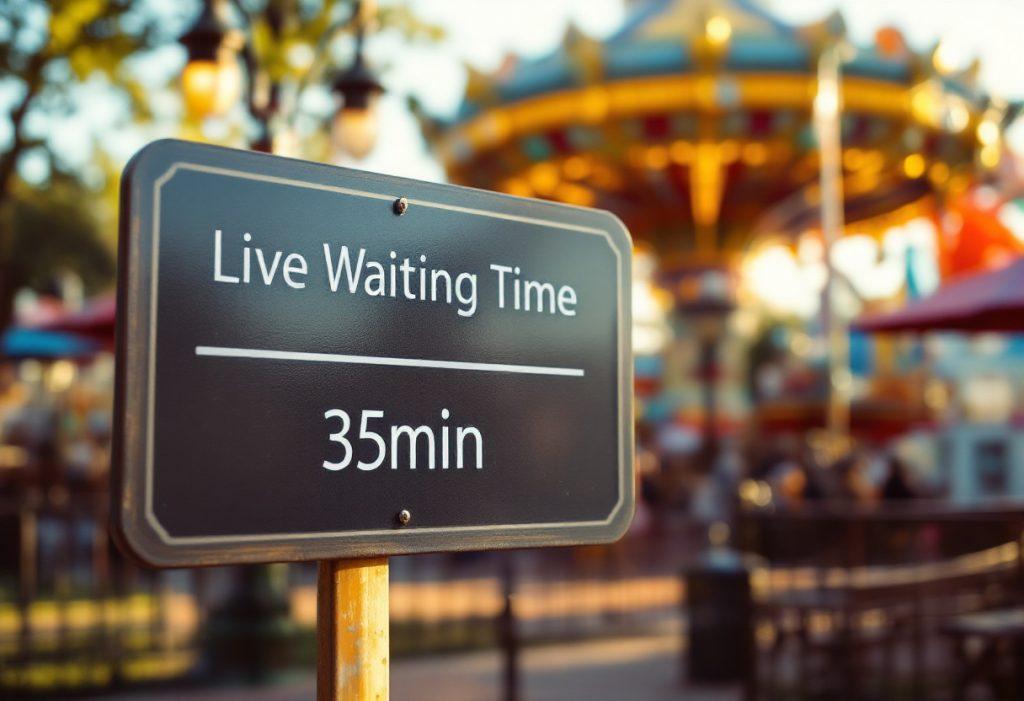
Display waiting times

Display waiting times

How long does the visitor wait for a ride to be used

Transport brand

Transport brand

Present your brand in a high-quality and contemporary way

pure.DSS

Digital Signage


Main
Provide information

Provide information

Announce park opening hours and point out special offers

Promote offers

Promote offers

Make customers aware of special offers

Development of Individual Software.
Customization, migration and hosting.

Individual Software Development
Actual state analysis

Actual state analysis

It serves to determine target/actual deviations and to detect defects and weak points in the organization and search for their causes.

Target concept

Target concept

The target concept serves the development of feasible solution approaches to the weak points and problem areas uncovered in the as-is analysis.

Project management

Project management

Performance evaluation, the preparation of forecasts and the decision on control measures are the main activities of our project management.

Contact

We look forward to hearing from you!